Memory Performance
Performance issues are generally seen in the overall memory utilization of ThingWorx solutions. If your solution uses the Java memory heap aggressively and constantly creates and discards large memory objects, you see some poor performance indicators in the memory metrics for this system. The frequency and duration of Java garbage collections play a significant role in the overall responsiveness of the system. If you have continuous garbage collection loops, the solution is stressed for memory, and this can make your entire ThingWorx Platform entirely unresponsive.
To monitor Java memory usage and garbage collection over time, it is recommended to enable GC logging. Tools, such as VisualVM, also display memory utilization information. However, if the JVM is unresponsive due to full GC loops, these external solutions may not be able to retrieve data to show the memory issues.
Note that when you monitor memory at operating system level, it does not provide information on how your ThingWorx solution uses the memory allocated to it. The monitoring tool retrieves data on how much memory Java requested from the operating system, but it does not show how Java uses the memory. Most performance issues are due to the internal memory usage in the Java heap space, not the operating system memory allocations.
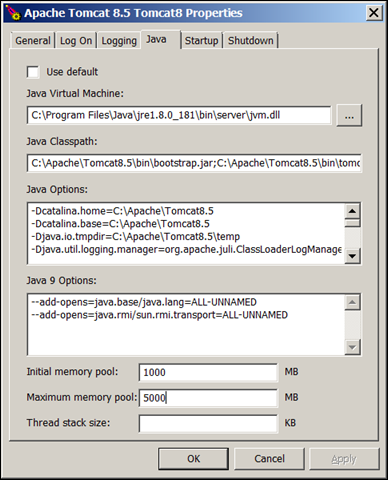
The overall memory allocated to Java is determined by the -Xms (minimum) and -Xmx (maximum) parameters that are loaded at runtime. The -Xms and -Xmx parameters specify the initial and maximum memory pool size, if Tomcat is configured using the tomcat8w configuration panel.
If no minimum or maximum values are specified at the start up, the Java process at startup uses a heuristic to preallocate these amounts. By default, Java attempts to allocate one-fourth of the overall RAM available in the operating system.
Operations That Cause Memory Issues
You must monitor the following operations that can cause memory issues:
• Extremely long and frequent full GC operations with the duration of 45+ seconds—Full GCs are undesirable, as they are stop-the-world operations. The longer the JVM pauses, the more memory issues there are:
◦ All other active threads are stopped while the JVM attempts to make more memory available.
◦ Full GCs take considerable time, sometimes minutes, during which the solution may become unresponsive.
• Full GCs occurring in a loop—Full GCs occurring in quick succession are called full GC loops. They can cause the following issues:
◦ If the JVM is unable to clean up any additional memory, the loop can go on indefinitely.
◦ The ThingWorx solution is unavailable to users while the loop continues.
• Memory leaks—Memory leaks occur in the solution when an increasing number of objects are retained in the memory. These objects cannot be cleaned, regardless of the type of garbage collection the JVM performs.
◦ When you check for memory consumption over time, a memory leak appears as an ever-increasing memory usage that was never reclaimed.
◦ The server eventually runs out of memory, regardless of the upper bounds set.