1. Define the function below. Insert the absolute value operator.
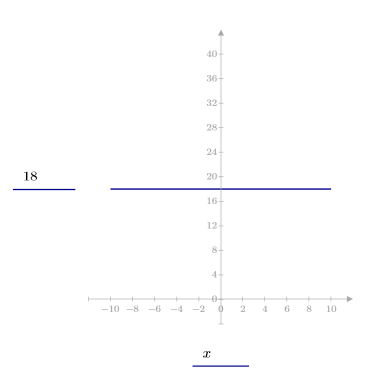
2. On the Plots tab, in the Traces group, click Insert Plot, and select XY Plot. An empty plot appears.
3. In the y-axis placeholder, to the left or right of the plot, type 18. Select and drag the y-axis legend to the left, if necessary.
4. In the x-axis placeholder, to the bottom of the plot, type x. Press Enter or click outside the plot region. A line trace appears.
You can move from one placeholder to the next by pressing Tab or Shift+Tab. Ignore the unit placeholders for this task.
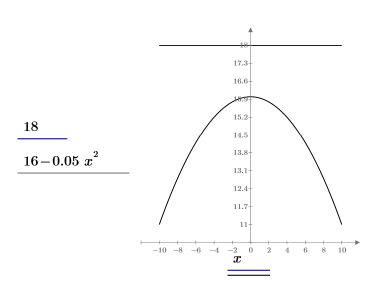
5. Place the cursor to the right of 18. Click Add Trace. A new y-axis placeholder appears below the current one.
When you place the cursor to the leftmost insertion point of an axis expression, and then you add an axis expression, the axis placeholder appears above the current one.
6. Type 16 - 0.05 x2 in the y-axis placeholder. Press Enter. A second trace appears.
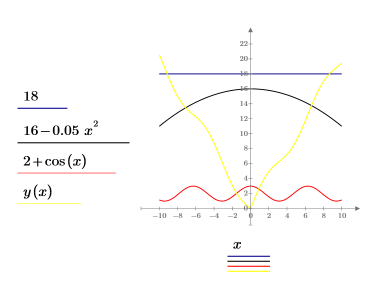
7. Insert two additional y-axis placeholders and type the following two expressions.
8. To change the trace color of an expression, such as y(x), click the expression and then on the Plots tab, in the Styles group, click Trace Color, and select a color.
• The axis expressions can contain built-in or user-defined functions.
• The y-axis expressions must have the same independent variable as the x-axis expressions. Here, the independent variable is x.
• You can use one axis-expression to define more than one trace, such as the x-axis expression for this plot.