Plots > 3D Plots > To Edit Tick Mark Values in a 3D Plot
To Edit Tick Mark Values in a 3D Plot
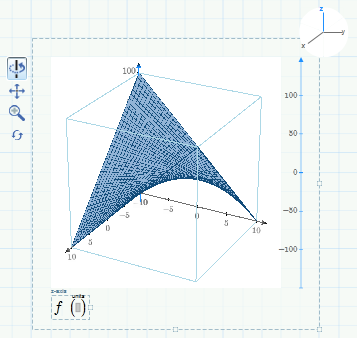
1. Click the 3D plot region that you want to edit.
2. On the axis selector, click the desired axis, such as the y-axis. The selected axis on the axis selector and in the plot turns blue.
3. On the editable axis, click the tick mark value you want to edit.
Alternatively, press the Tab key to select the next tick mark value on the editable axis or press Shift+Tab to select the previous tick mark value.
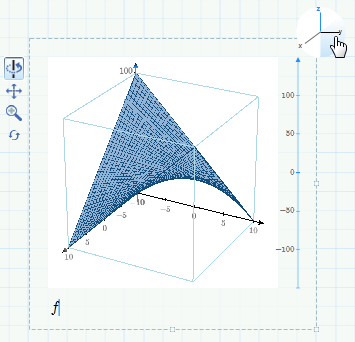
The editable axis is always displayed vertically.
You can only edit the first, second, and last tick mark values of each axis.
4. To edit the selected tick mark value, delete the default value, and then type a real number or an expression that evaluates to a real number.
5. Press Enter. All the tick marks of the axis change accordingly.
If you insert a constant such as π, its numeric value is displayed.
When you edit the first or the last tick marks, the plot viewable range changes. When you edit the first or the second tick mark, the interval between the tick marks changes.