|
Expression
|
Description
|
|
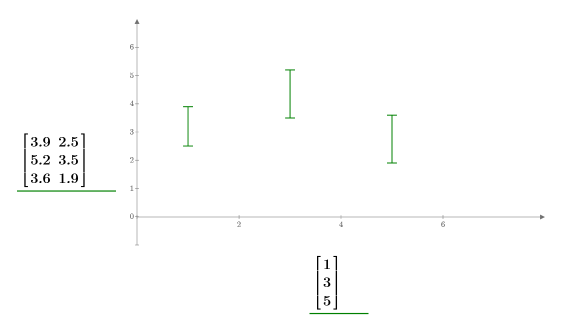
y-axis
|
A matrix with two elements per row: the data for the two whiskers of the error bars
|
|
x-axis
|
A column vector of x values
|