To Create a Box Plot
1. In a worksheet, insert an XY plot.
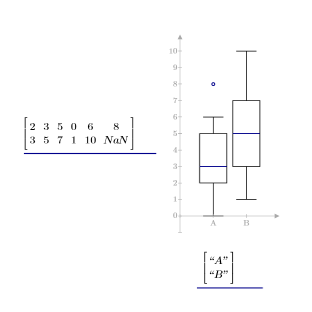
2. Type the following expressions:
|
Expression
|
Description
|
|
y-axis
|
A matrix where each row contains the three quartiles (25%, median 50%, and 75%), the minimum value, the maximum value, and the outliers of a data set
|
|
x-axis
|
A column vector of strings labeling the data sets
|
3. Press Enter. A line trace appears.
4. Select the trace.
5. On the Plots tab, in the Traces group, click Change Type. The Change Trace Type list opens.
6. Select Box Plot Trace. A box plot appears with one box per row of the y-axis matrix.
Additional Information
• You can use the boxplot function to calculate the transpose of the array in the y-axis expression.
• When data sets do not have the same number of outliers, add NaNs in the empty array elements of the y-axis expression.
• When the x-axis expression has only one element, you must enter it as a one-element vector and not as a scalar or a string.
• Each row of the arrays in the x-axis and y-axis expressions represents one data set. To create additional box plots, add new rows to these arrays.