1. In a worksheet, click where you want to insert a 3D plot and press Ctrl+3. An empty 3D plot region appears.
Alternatively, on the Plots tab, in the Traces group, select 3D Plot from the Insert Plot list.
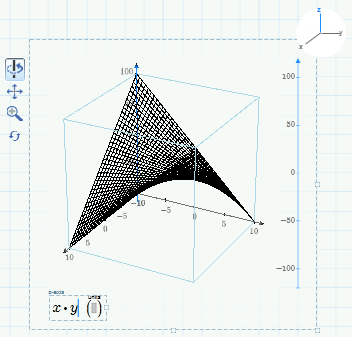
2. In the expression placeholder, type a valid input and press Enter. The 3D plot appears in the plot region.
To change the plotted ranges when plotting a function, you can edit the tick mark values, define range variables above the plot, or use CreateSpace or CreateMesh.