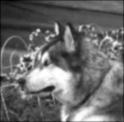
This kernel is symmetric, so the effect is the same as convolution - equivalent to correlation with the kernel reversed.
4. Calculate the correlation, then scale the result to 8-bit grayscale from 0 to 255.
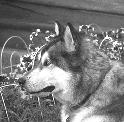
5. Plot the original image and the correlation of the image with the kernel.
(greyscale_dog.bmp)
(dog_cross.bmp)
Prototype Matching
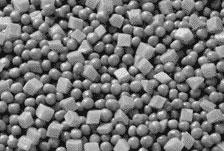
1. Read in a new image.
(peas_carrots.bmp)
The selection picks out a representative carrot as a template.
2. Define the height and width of the template.
3. Define function val and use it in the matrix function to create the template.
4. Plot the template and the carrot images
(template.bmp)
(carrot.bmp)
5. Define the correlation threshold
6. Use the uniform template of the same size as the selected carrot, or use the selected representative carrot image itself to calculate the number of matches:
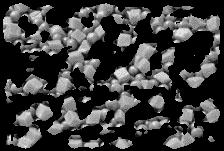
(carrot_vect.bmp)
Most of the peas are blacked out by the uncorrelated, threshold values, and most of the carrots are still visible. The match is made between the original image and the rectangular template of uniform density, which roughly picks out the carrots in this random sampling from a frozen vegetable package.
7. Calculate the approximate percentage of carrots in the original image
This technique is also useful for bacteria counting, and other image feature percentage estimation.