This function generates a histogram for the elements of matrix M by dividing the intensity range into n bins. Each bin contains the number of pixels that fit its intensity level range. For instance, if n = 256, there is one bin for each possible intensity level in an 8-bit grayscale image. If there are fewer than 256 bins, the intensity levels are divided into bins in the following way:
Bin labeling starts with 0. If there are more than 256 bins, the bin sizes are smaller than 1.
1. Define a small matrix to see the relationship between the values and the appearance of the histogram.
2. Define the number of bins for applying the imhist function to the above matrix.
Because n = 255, each of the 256 intensity levels gets its own separate bin. As can be seen from matrix P, the only bin that should have more than one count is 150.
3. Plot a histogram of the intensity levels.
4. Set n to a smaller number, such as 5, and observe the difference.
Because n = 5, the 256 intensity levels must be divided into 5 separate bins. Intensity values from 0 to 256/5 are included in bin 0, values from 256/5 to 512/5 are included in bin 1, and so on.
As can be seen from matrix P and the above histogram, the intensity values are distributed as follows:
◦ 0, 30, 40 are in bin 0 (0-51)
◦ No intensity values are in bin 1 (52-103)
◦ 120 and three counts of 150 are in bin 2 (103-154)
◦ 200 is in bin 3 (154-205)
◦ 240 is in bin 4 (205-256)
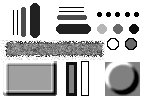
5. Read in an image that contains white space.
(pattern.bmp)
6. Apply the imhist function to the image.
The white space (intensity value=255) in the image appears as a large spike on the right. Black and other distinct gray tones can be seen in other bins.
7. Calculate the number of items in bin 0 (black) and bin 255 (white).
The different shades of gray areas in the picture appear as smaller spikes along the x-axis.
imhist2
This function may be used to bin data with values outside the 0–255 range.
1. Define a matrix that contains elements outside the 0–255 range.
2. Define the number of bins and compute the n-bin histogram.
3. Calculate the endpoints of the n bins.
hist2d
This function generates a two-dimensional histogram of two images M and N, creating n bins in each dimension. M and N must be the same size. If the two images have similar numbers of pixels at similar intensities, the output matrix from hist2d has a strong diagonal. The function divides the 0–255 range into n bins.
1. Define the number of bins and the two equally-sized image matrices.
2. Use the vectorize operator with the bin_label function defined above to calculate the bin numbers for P and Q.
The two-dimensional histogram is an n x n matrix, with a count at column c and row r whenever there is an element of Pbins with bin number c, and the corresponding element of Qbins has count r. For instance, the first elements of Pbins and Qbins are 0 and 2, so they generate one count at column 0, row 2 of the histogram matrix.
3. Calculate the histogram matrix by first generating a matrix of zeros and then adding the counts.
4. Compare the above output with the output of hist2d.
5. For a more concrete example, consider the following color image.
(smallwar.bmp)
6. Extract the green and blue components separately to allow comparison of the two color components.
7. Show the two-dimensional histogram.
(hist2d.bmp)
8. Show the two-dimensional histogram as an image of intensities on a log scale.
Examine the image and observe the different intensities. The strong diagonal in this two-dimensional histogram means that most pixels in corresponding locations had similar intensities. This is not unreasonable in two color components from the same photograph. The diagonal would be less prominent in two images with very different textures.