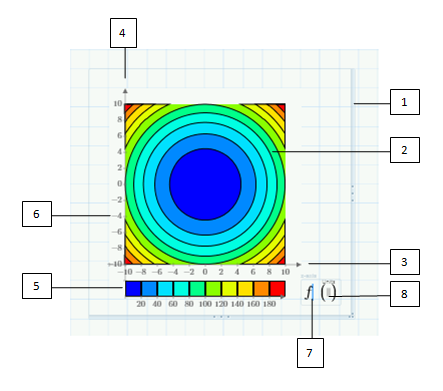
Contour plots enable you to view 3D data in a 2D plot. Each contour represents a z value. You can control the contours by editing the tick marks on the z-axis.
1. Plot region
2. Contour
3. x-axis
4. y-axis
5. z-axis and color scale
6. Tick mark value
7. Axis expression
8. Unit placeholder
Working with Contour Plot Parts
You can edit and format contour plots as you do for XY plots. There are however a few differences:
• Trace Type—You cannot change the trace type of a contour plot but you can change its style – thickness, color, and line.
• Moving the axis expression—You cannot move the axis expression.
• Contour Lines—You can show or hide the contour lines.
• Contour Values—You can show or hide the contour values.
• Color Scheme—You can select from seven color schemes.