Accessing the Dashboard
Before you can view your data in the dashboard, ensure that you meet the following requirements:
• You have a global support account with PTC.
• Sufficient time has passed for data from the PTC Diagnostic Tools to be viewable in the dashboard. This generally takes a maximum of two hours.
To access the dashboard:
1. Open a web browser and type https://support.ptc.com in the address bar.
2. Log in using your account credentials.
3. Browse to the Manage & Monitor Software section. Click Performance Advisor - System Dashboard under Proactive system scans and performance. The PTC Performance Advisor page is displayed.
4. Click Performance Advisor for PTC Arbortext Content Delivery to open the PTC Arbortext Content Delivery Performance Advisor dashboard.
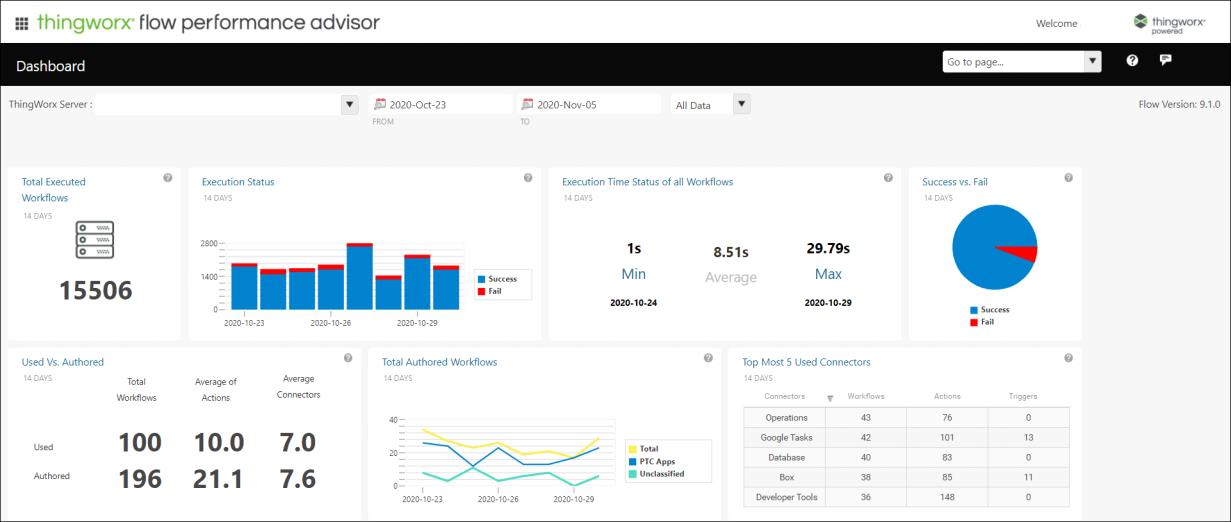
5. Click Performance Advisor for ThingWorx Flow to open the ThingWorx Flow Performance Advisor dashboard.