Using Maximum and Minimum Legend Values to Get More Details
The maximum and minimum values you enter in the Format Legend dialog box determine how the shading will be graded for your model. You can use these values to get a better idea of how a particular range of values is distributed over your model.
For example, if you enter a new maximum that lies halfway between the calculated minimum and maximum for the quantity, Creo Simulate shades all areas that fall above that value red, assuming you are using the Structural color spectrum. The software linearly re-scales the values that lie between the new minimum and maximum. As a result, you will be able to see a more detailed fringe of the lower ranges of your model.
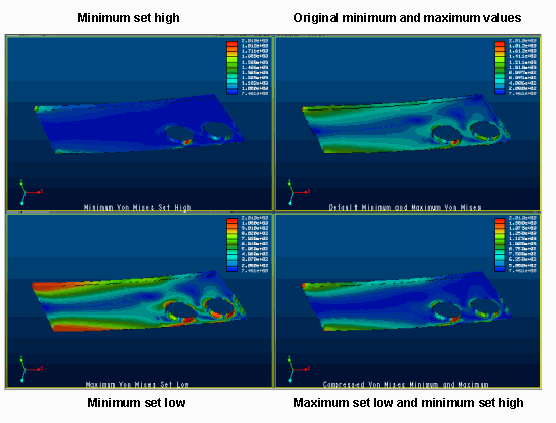
To see the difference between a default view and various alternate settings for the legend minimum and maximum, study this illustration:
Note that with the maximum set low, you see much more detail on the lower half of the original range than you do in the original model. On the other hand, you can get more definitive information on the upper half of the original range, with the minimum set high. For example, were you to zoom in on the left hole for the version that shows the minimum set high, you would see a more exact representation of the stress distribution around the high stress area at the bottom of the hole.
| Tip: You can also control the level of detail in your plots by specifying either fewer or more legend levels. |

