About Exploring Topology Element Density
You can explore the topology element density results in several ways when you select the
 Topology Element Density
 response.
Elements are the small units that make up the model. Each element that was optimized has a density value. It is the topology design variable value (volume fraction) for each element. The value ranges from 0.0 through 1.0. In optimization, elements with a value close to 0.0 are usually removed, and elements with a value close to 1.0 are usually kept. Typically there are many elements with intermediate density.
You can define a lower cutoff value that determines the lowest density value at which an element is kept.
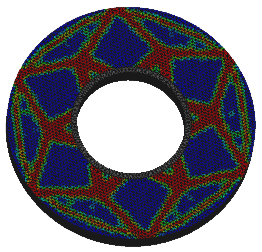
Topology Element Density Plot
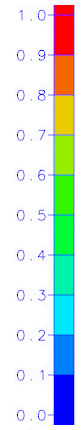
In a topology element density plot, each density value is assigned a color. In the image below, the red color indicates a high density, and the blue color indicates a low density.
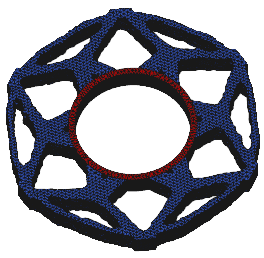
Topology Element Density Isosurface
An isosurface is created by generating a surface that passes throughout the model wherever the element density equals the specified cutoff value. The isosurface encloses all regions where the density is greater than the lower cutoff value.
The lower cutoff value is not related to the mass fraction of the model. This cutoff is only used to determine which elements should be included in the topology result. Any element with a density value less than this cutoff value is excluded.
In the image below, blue indicates the elements that are kept in the model because their density value is higher than the cutoff value. Red indicates elements that were excluded from the optimization.