Using the Results Legend in Creo Simulation Live
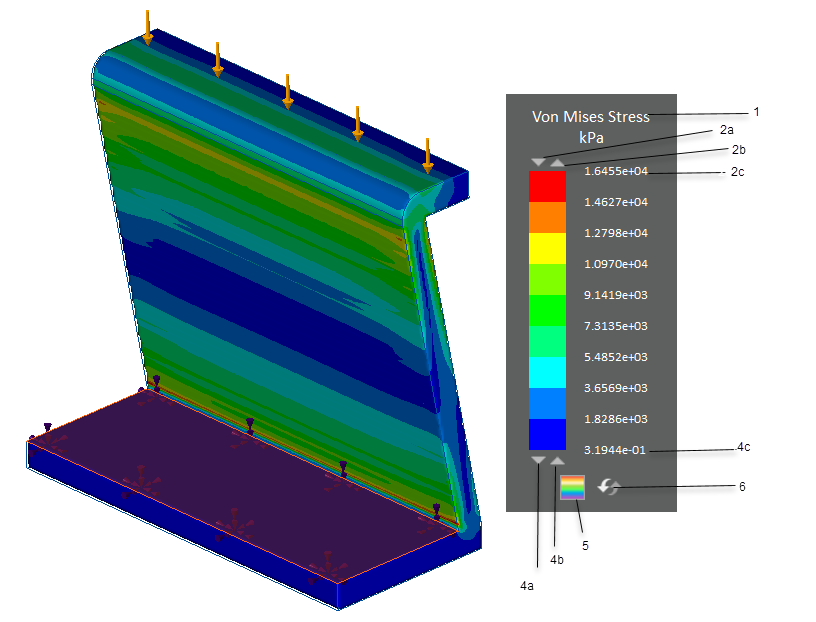
You can use the results legend to vary the color range of results displayed in the model. For example, in the following figure the default values of the color band are displayed. The maximum value of Von Mises stress that is displayed is approximately 16MPa, and the minimum value is close to 0. The following figure illustrates the function of the various items on the results legend.
• 1–Result Quantity
• 2a—Click or click and hold this arrow to decrease the maximum value to display.
• 2b—Click or click and hold this arrow to increase the maximum value to display.
• 2c—Double-click to specify a value for the maximum value to display.
• 3—Color bands in the result.
• 4a—Click or click and hold this arrow to decrease the minimum value to display.
• 4b—Click or click and hold this arrow to increase the minimum value to display.
• 4c—Double-click to specify a value for the minimum value to display
• 5—Click to toggle between displaying results as distinct color bands and as diffused colors.
• 6—Click to reset the legend to the default value.
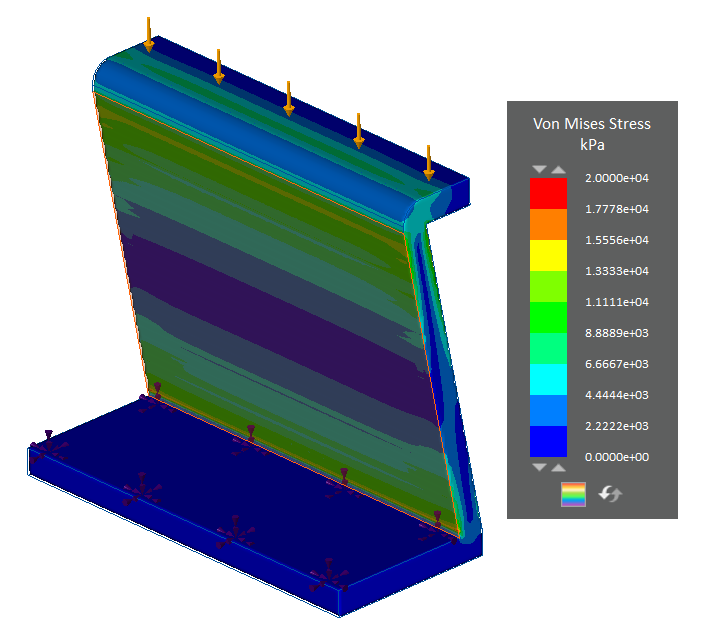
For the same simulation in order to show a wider range of results—for example, from 0 to 20, use one of the following methods to change the maximum and minimum values:
• Click the upper right arrow to increase the maximum value to 20 MPa or click the upper left arrow to decrease the maximum value to 20 MPa.
• Click the lower right arrow to increase the minimum value to 0 MPa. or click the lower left arrow to decrease the minimum value to 0 MPa.
• Double-click the maximum value and specify a value of 20 MPa. Double-click the minimum value and specify a value of 0 MPa.
The range of displayed results is from 0 to 20 MPa as shown in the following figure. Fewer results are red in this case.
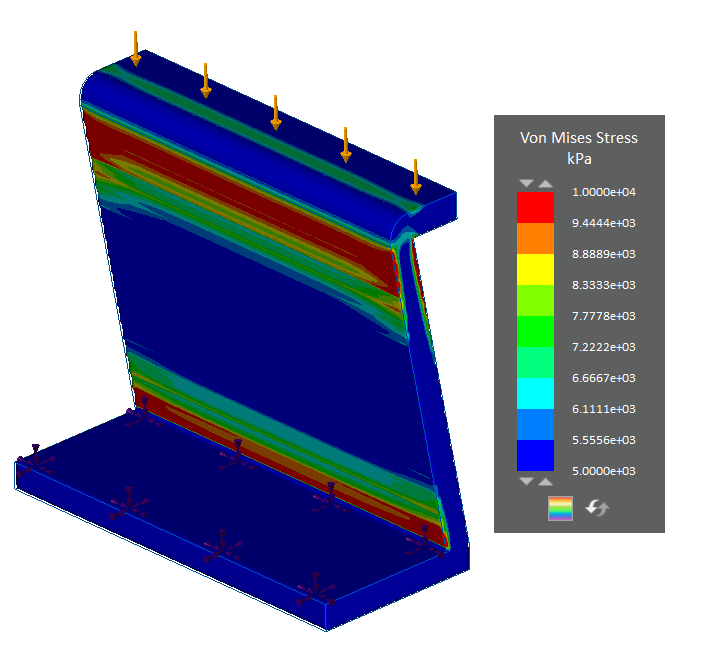
Similarly, in order to view a decreased range of results for the same simulation—for example to view results between 5 and 10 MPa you can double click the maximum result value and specify a value of 10MPa and double-click the minimum result value and specify a value of 5MPa. Alternatively, click or click and drag the upper and lower arrows to change the minimum and maximum values. The range of results is now from 5 to 10 MPa as shown in the following figure. There are now more results in red.
Click

to reset the legend to the default value.
Click

to toggle between displaying the results as diffused colors or distinct color bands.