Distribution Types
Creo Tolerance Analysis powered by CETOL Technology provides three distribution types for the analysis: Normal (Gaussian), Uniform, and Lambda.
Statistical variation is represented in the tolerance model with one of these three distribution types.
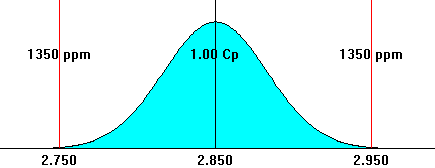
Normal (Gaussian) Distribution
A normal distribution can be completely defined in terms of two parameters: mean and standard deviation. In PTC Creo Parametric Tolerance Analysis, the distributions for all part dimensions are assumed to be normal.
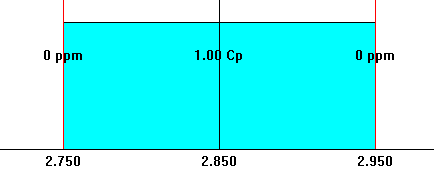
Uniform Distribution
A uniform distribution can be completely defined in terms of two parameters: min and max. In PTC Creo Parametric Tolerance Analysis, the distribution for the clearance for floating interfaces is assumed to be uniform.
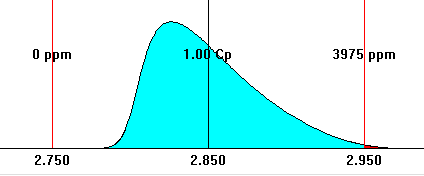
Lambda Distribution
The lambda distribution is a statistical distribution defined in terms of four lambda parameters. The Standard Moments Lambda (Lambda) distribution is a very flexible generic distribution defined in terms of four lambda parameters but specified using mean, standard deviation, skewness and kurtosis.
An analysis may result in a lambda distribution if you have any floating interfaces in the measurement definition. Otherwise, the results will always have a normal distribution.