Example: Sensitivity Analysis
Summary—his example shows you how to create a sensitivity study to investigate the relationship between two model parameters.
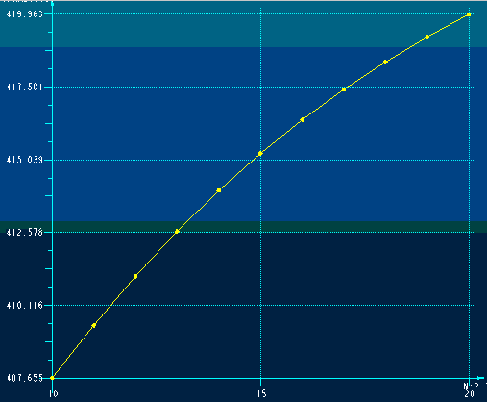
Problem—Need to analyze how the part mass changes as you change the number of teeth in the gear.
Solution—Create an analysis feature to measure the mass of the gear. After you create the MASS parameter, you can conduct a sensitivity study to investigate how the mass changes as you change another parameter, the number of teeth in the gear.
The following steps outline this example:
1. Create an analysis feature to measure the mass of the gear.
2. Click
Analysis and then click the arrow next to
 Mass Properties
. Click
 Mass Properties
. The
Mass Properties dialog box opens.
3. Click the Analysis tab if it is not selected by default and select the type of analysis.
4. Click Saved to display and dynamically update the analysis while modeling.
5. Enter a name for the analysis, for example, gear_mass.
6. Click the Definition tab to customize or edit your analysis.
7. Under Coordinate System, the selected coordinate system is displayed in the collector. Click Use default to select the default coordinate system.
8. Under Density, specify the material density. The density value is saved with the model. The default value is 1.
9. Click

to compute the analysis. A coordinate system is displayed at the center of gravity in the
Creo Parametric graphics window. The result of the analysis is displayed in the Results box and the report is displayed in an information window.
10. Create a sensitivity analysis by clicking
Analysis >
 Sensitivity Analysis
. The
Sensitivity dialog box opens.
11. Click Parameter.
12. Click the number of teeth (N) as the parameter to vary and click OK.
13. Set the range to 10–20 teeth.
14. Select a parameter to plot (MASS) and click OK.
15. Specify the number of passes, for example, 11.
16. Click Compute.
17. Inspect the graph produced by the analysis.
The following graph shows the output of the sensitivity study. The graph shows how the mass of the gear (y-axis) changes as you change the number of teeth (x-axis). The number of points in the resulting curve corresponds to the number of computations within the selected range.
 Mass Properties. Click
  Mass Properties. The Mass Properties dialog box opens.
 Mass Properties. Click
  Mass Properties. The Mass Properties dialog box opens.
 Mass Properties. Click
  Mass Properties. The Mass Properties dialog box opens.
 to compute the analysis. A coordinate system is displayed at the center of gravity in the Creo Parametric graphics window. The result of the analysis is displayed in the Results box and the report is displayed in an information window.
 Sensitivity Analysis. The Sensitivity dialog box opens.