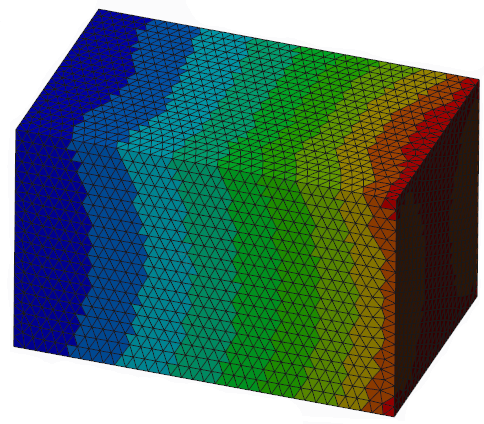
To Explore the Color Mesh
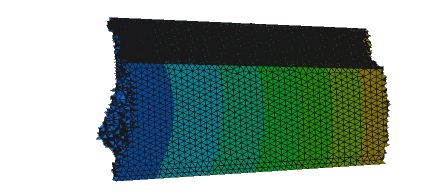
The color mesh shows each element in a color based on the element’s result value.
Explore by elements or contours
You can view the color mesh in two ways, based on how the boundary between values is shown:
•  No Fills
—Does not show color fills.
• Click
Results >
 Filled Elements
 to show each element filled completely with its result value color. The results are averaged to the elements.
• Click
Results >
 Filled Contours
 to show contour lines based on grid result values. The results are averaged to the grids, so the contour lines appear smoother.
Hide portions of the color mesh
You can hide portions of the color mesh based on the result value:
• Show the entire color mesh:
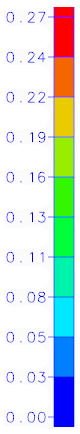
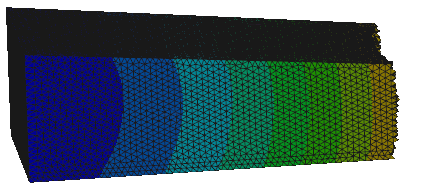
• Use the Element Masking Upper Cutoff slider or box to hide elements that have a value above the upper cutoff:
• Use the Element Masking Lower Cutoff slider or value box to hide elements that have a value below the lower cutoff:
• Use both the Element Masking Upper Cutoff and Element Masking Lower Cutoff slider or box:
Set the value range for the color bar
To define the method to control the value range for the color bar, choose an option:
• Automatically—Click Color Mesh, and then select the Auto Range check box.
• Manually—Click Color Mesh, clear the Auto Range check box, and enter these values:
◦ Min. Value—Set the minimum value for the color bar.
◦ Max. Value—Set the maximum value for the color bar.