Strategy: Using Convergence Graphs to Review Results
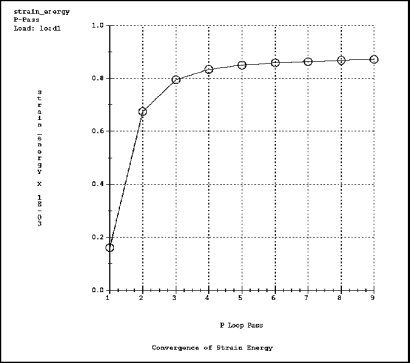
You can use a convergence graph to determine whether a measure quantity converged acceptably. In a graph that shows good convergence of a measure, the curve becomes asymptotic as it plots values for the final p-passes. The following graph shows how the strain energy in a model converged with each p-loop pass.
Measures you might want to graph include strain_energy or max_disp_mag for static analyses, modal_frequency for modal analyses, and energy_norm, max_temperature, or max_flux_mag for thermal analyses.
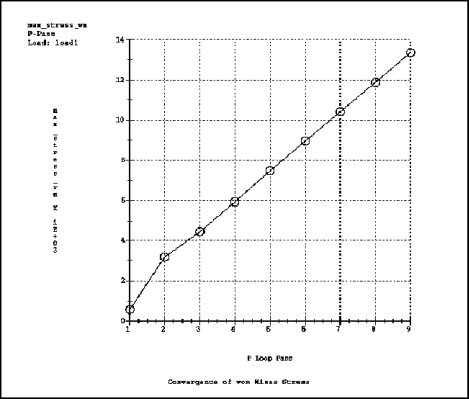
Note that if an analysis converges on local displacement and strain energy or local temperatures and local energy norms, the stress or flux values may not converge. The following graph shows that maximum von Mises stress values are still increasing as of the final p-pass and, therefore, did not converge.
| Tip: To facilitate convergence, create a layer of small elements around features that exhibit high stress or flux concentrations. You can also create excluded elements around stress or flux singularities. For more information, see Singularities and Isolate for Exclusion AutoGEM Control. |
If you are interested in stresses or fluxes, create a convergence graph of the particular stress or flux measures of interest to you.


