ThingWorx Software Content Management Dashboard
The ThingWorx Software Content Management Dashboard allows you to review your action items, the overall status of packages and deployments, and the historical deployment
status.
 Tip
Tip
My Action Items
Displays the status of the deployments started by you. MY ACTION ITEMS lists the number of deployments that are in the following states:
- Failed
- Expiring
- Expired
Overall Package Status
Displays the status for all packages created in the ThingWorx Software Content Management application. It identifies the total number of packages created, and the number of packages that have and have not been published.
You can view more information on either the Published or Not Published, double-click the appropriate section on the pie chart.
To view a specific package, you can select it from the My Recent Packages drop-down. The View Package Details page appears with more information about the package.
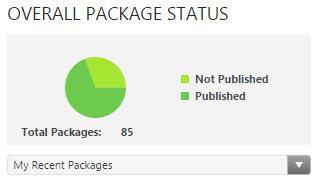
Packages that have not been published are still editable and cannot be used for a production deployment. Published packages
are ready for production deployment. You cannot edit, delete, or re-publish published packages.
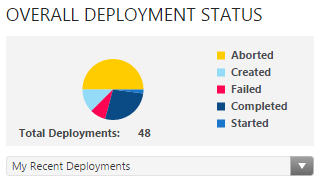
Overall Deployment Status
Displays the status for all production deployments created in the ThingWorx Software Content Management application. It displays the number of deployments that have been created, started, aborted, failed, or completed. It also
lists the total number of deployments under the pie chart. You can view more information for a represented status by double-clicking
the appropriate section on the pie chart.
To view a specific deployment, you can select it form the My Recent Deployments drop-down. The View Assets For Deployment page appears with more information about that deployment.
Historical Deployment Status
Displays a graph that organizes historical deployments by status and date. You can filter the graph using the Status: and By: drop-down menus, and by specifying a data range using the Between: calendar pickers above the graph.
 Note
Note